makinmappinhappen
Sunday, April 17, 2011
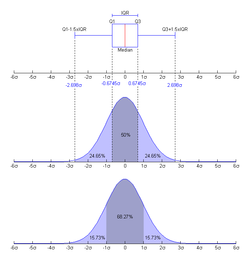
Box Plot
www.absoluteastronomy.com/topics/Box_plot
The Box Plot is a way of graphically identifying one or more sets of data. Box plots are best used when comparing distributions between several data sets.
No comments:
Post a Comment
Newer Post
Older Post
Home
Subscribe to:
Post Comments (Atom)
No comments:
Post a Comment